How To Get Application Last Monitoring Status?
Updated on 25 Apr, 2024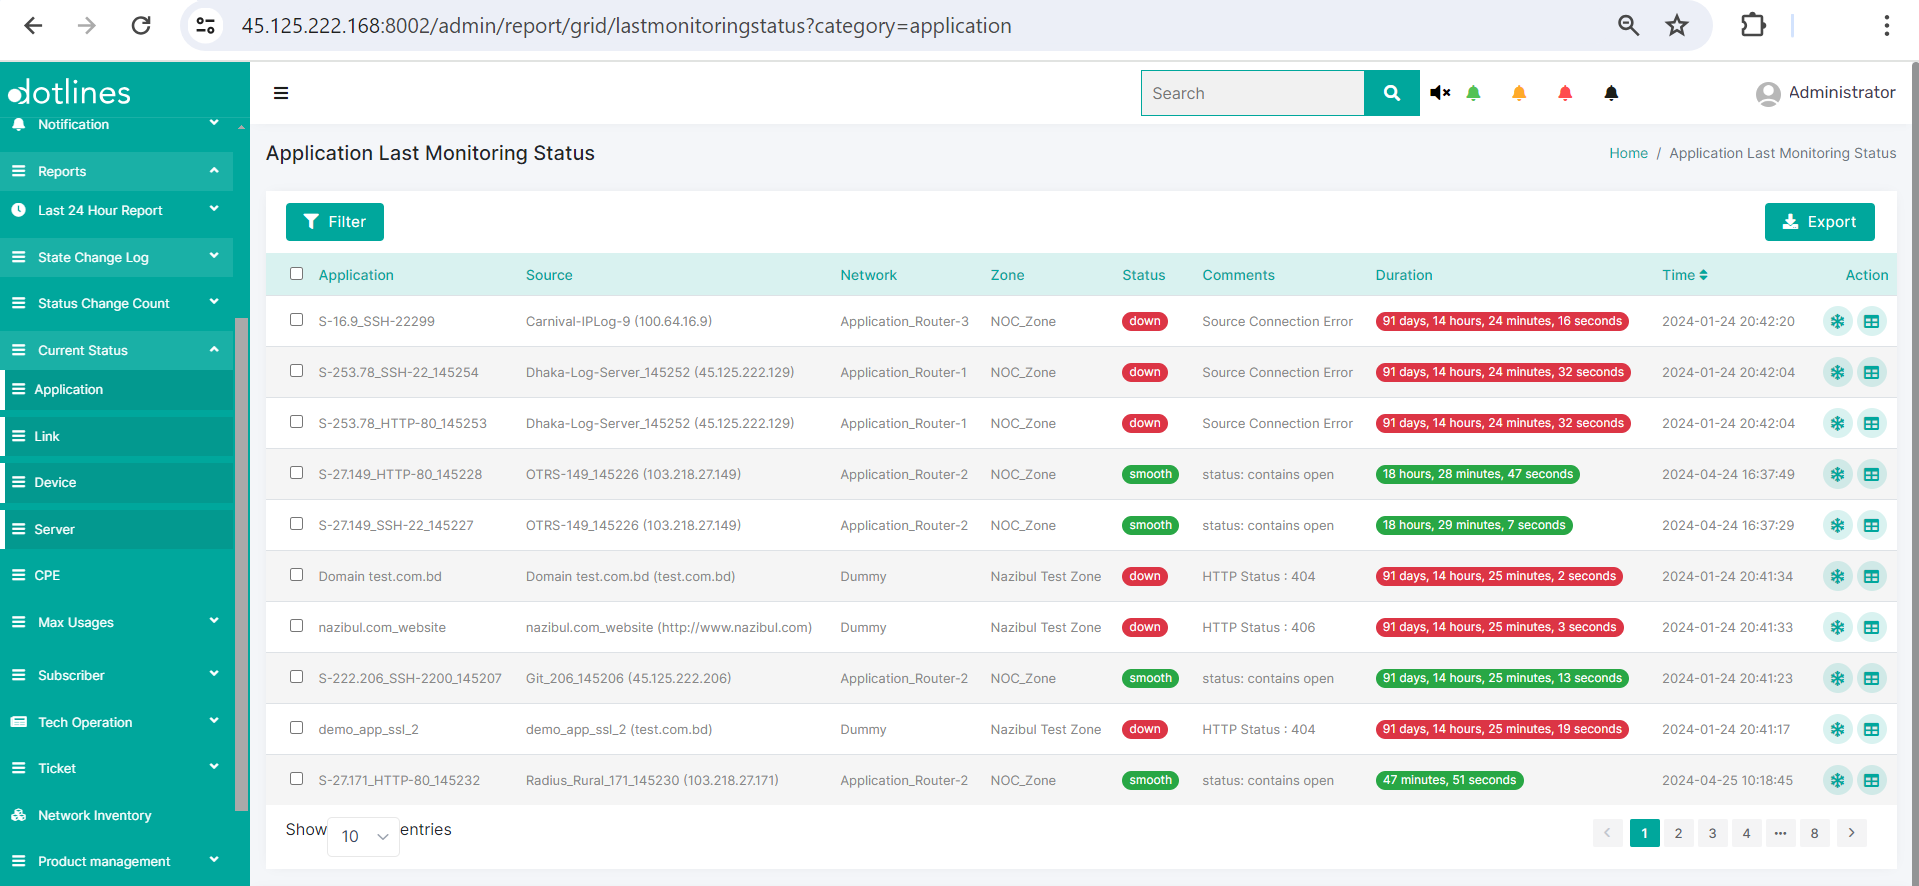
1. Go Reports> Current Status> Application
2. A list of application last monitoring statuses containing Application, Source, Network, Zone, Status, Comments, Duration and Time(in date-time format) will be showed.
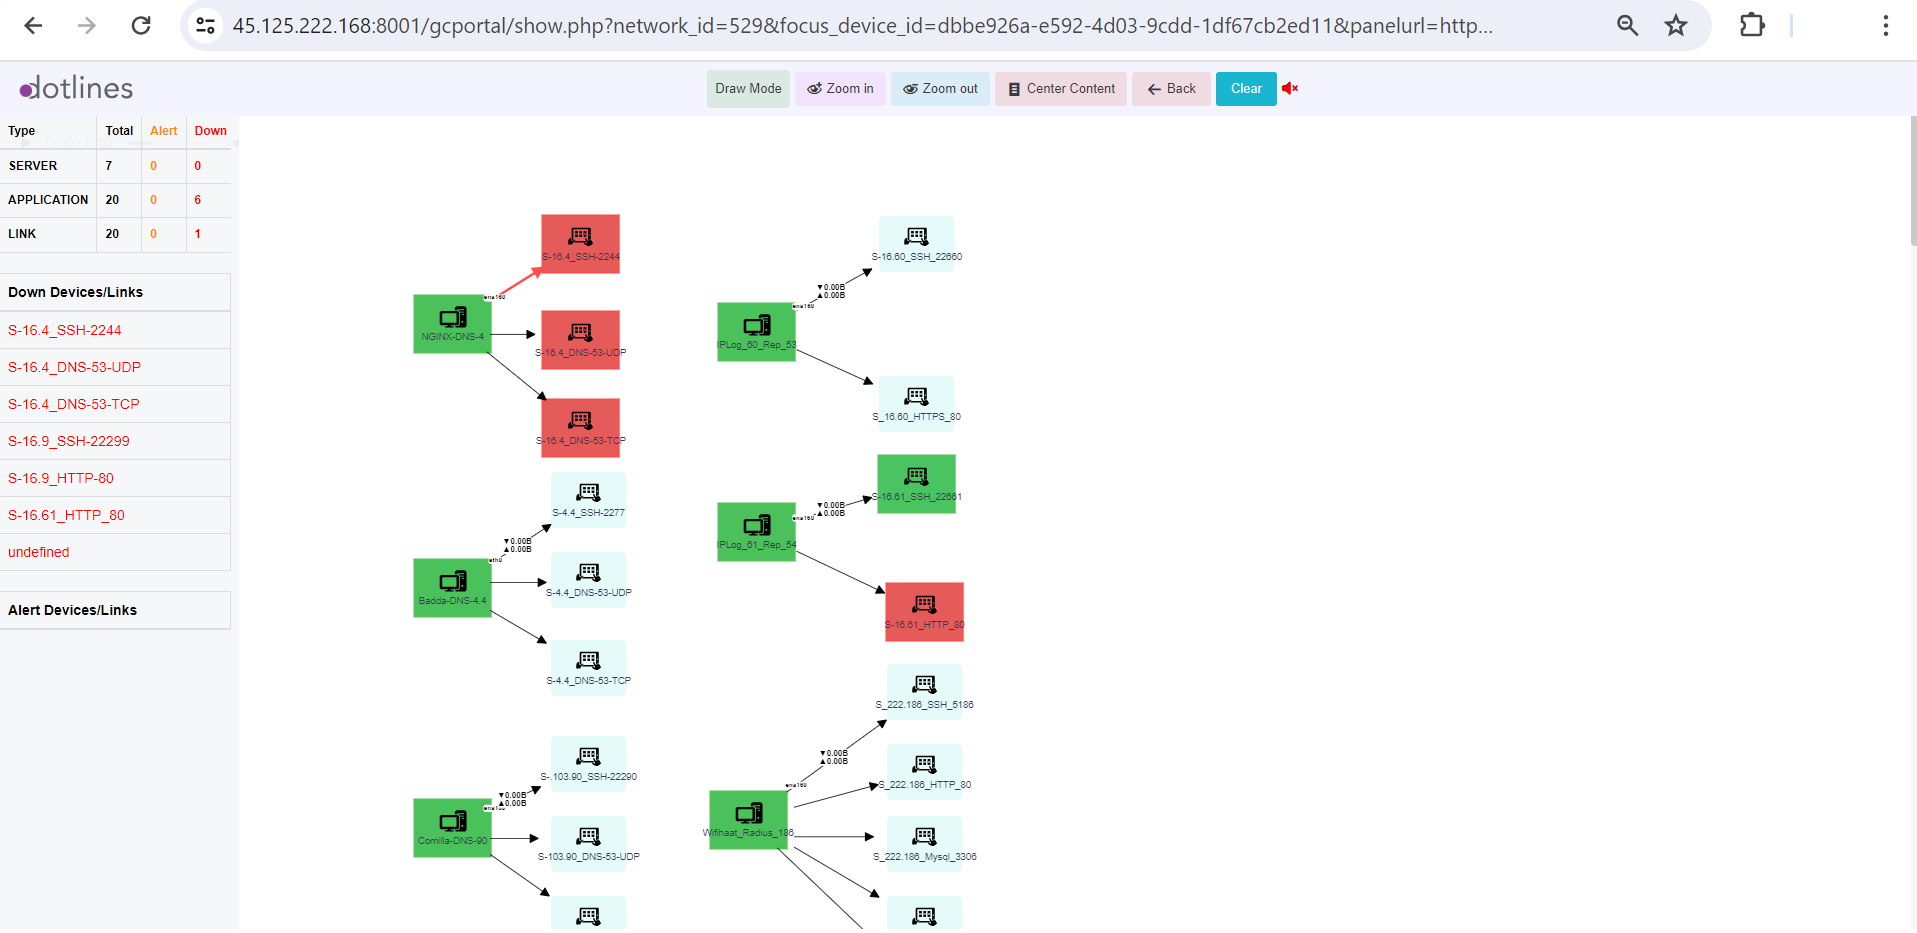
3. From list of application last monitoring status, click  to get Graph View of the certain application.
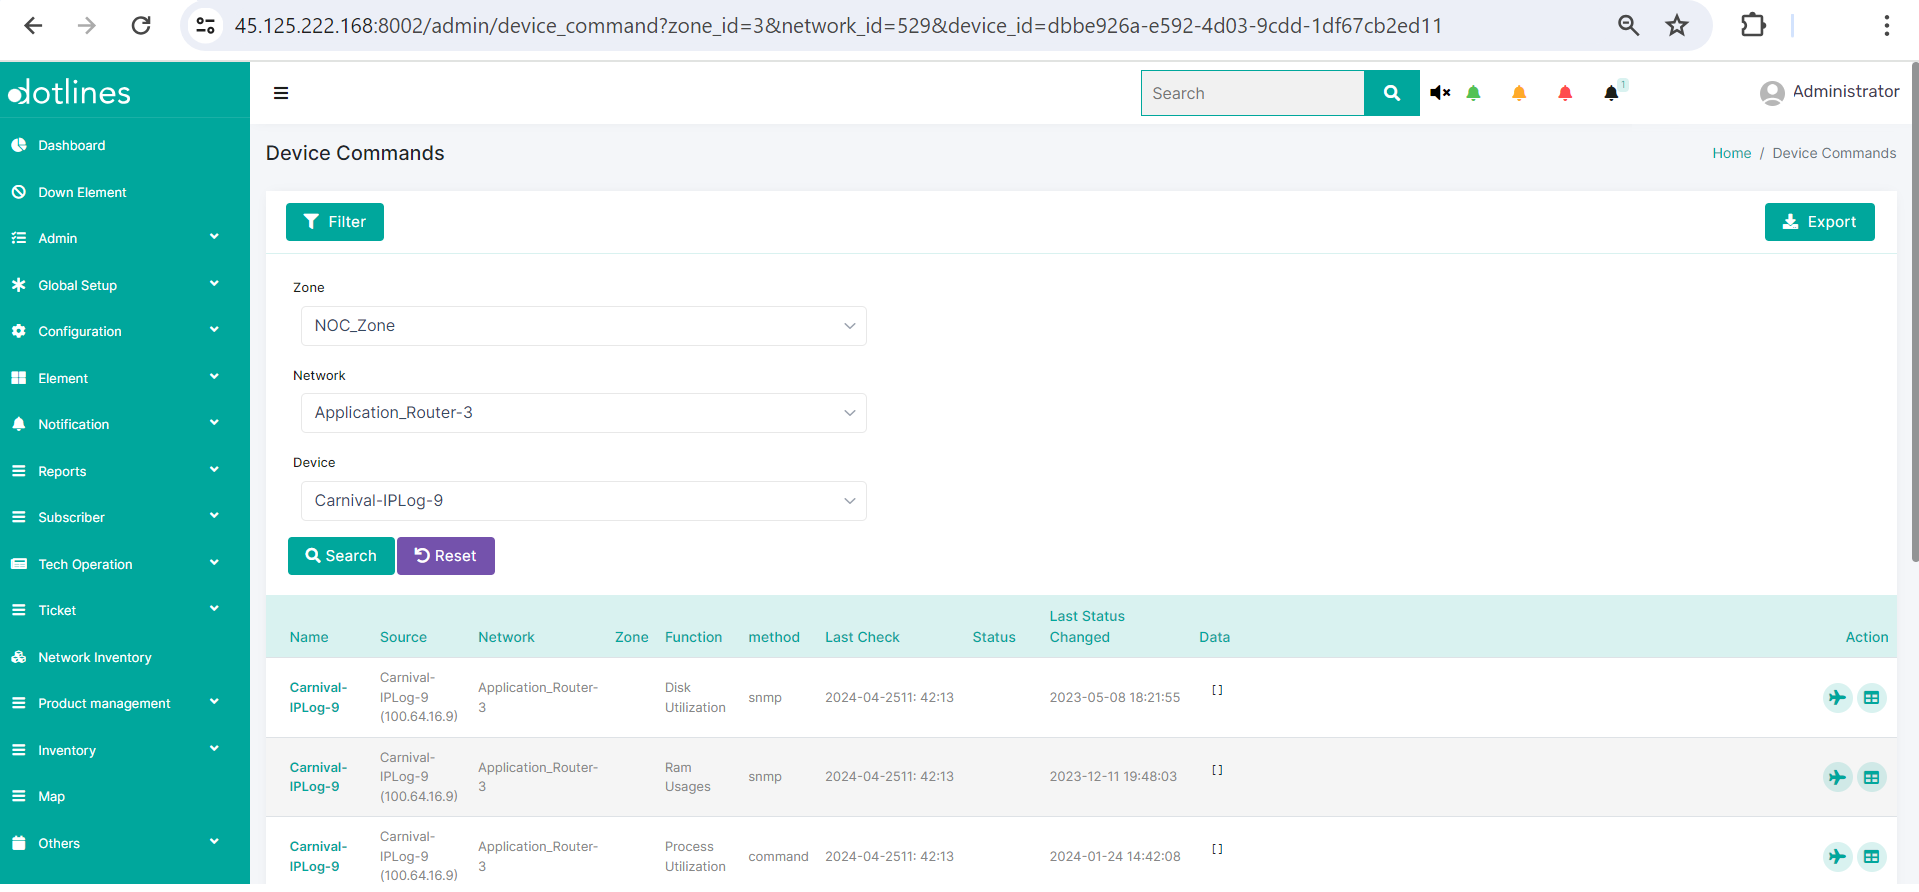
4. From list of application last monitoring status, click  to get the detail log containing Name,Source,Network,Zone,Function(e.g., Disk Utilization),method(e.g., snmp),Last Check(in date-time format),Status,Last Status Changed(in date-time format) and Data
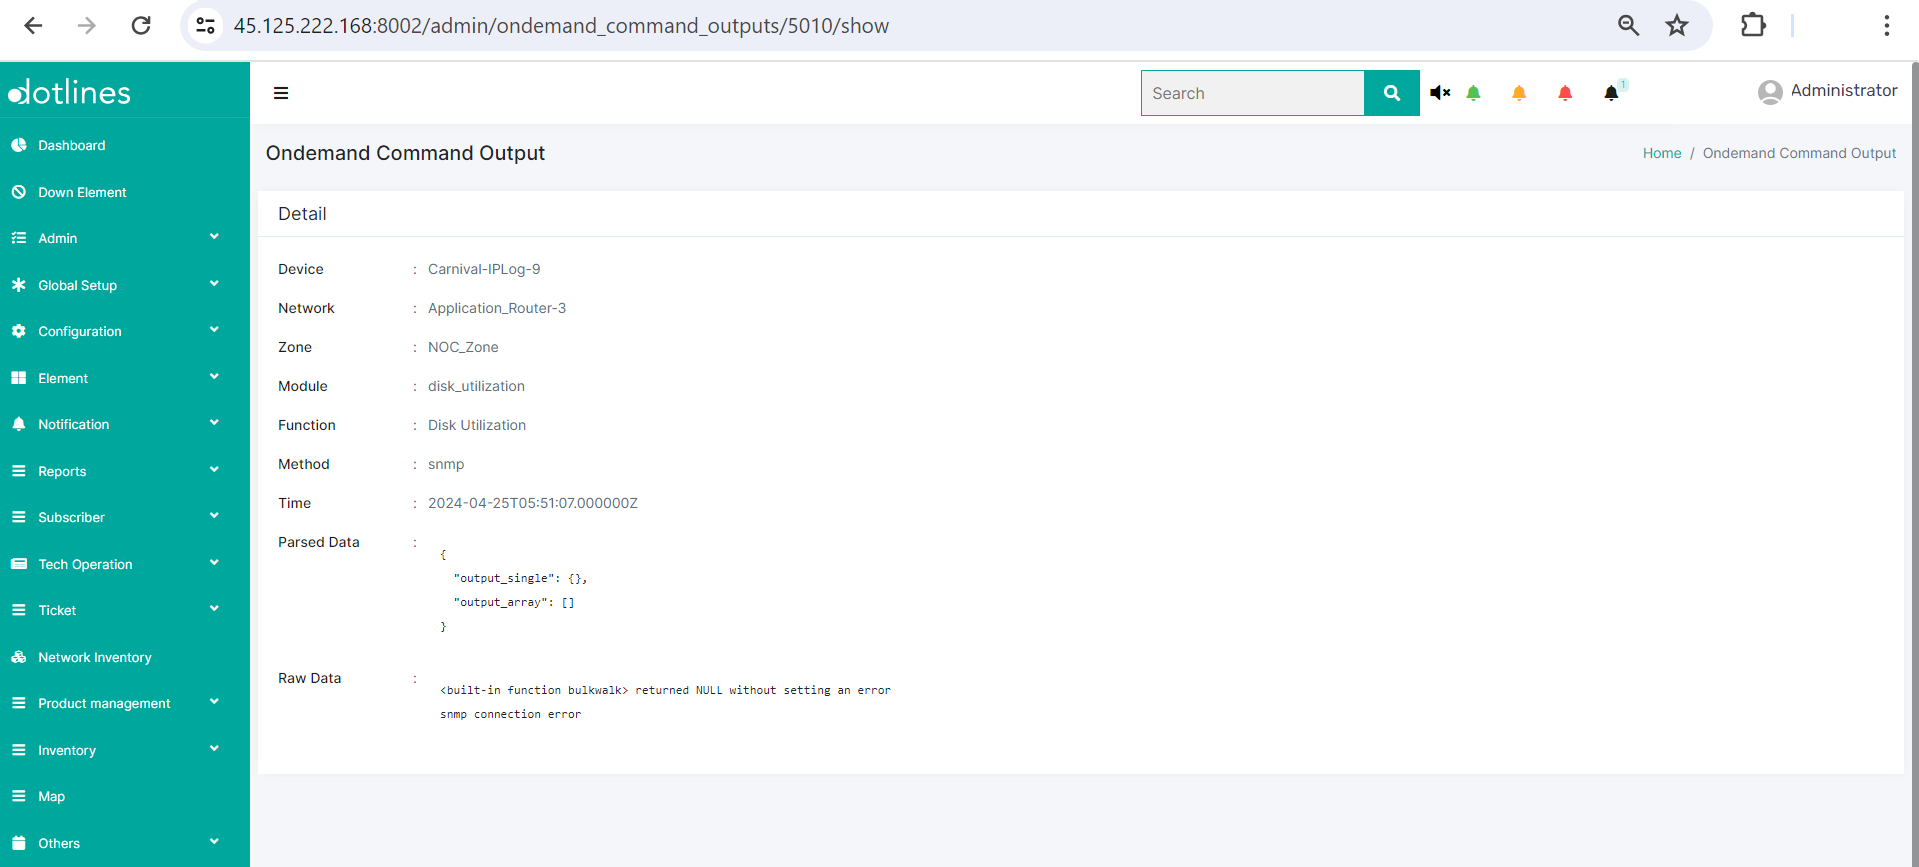
5. Click  to get the instant command output containing Device, Network, Zone, Module, Function(e.g., Disk Utilization), Method(e.g., snmp), Time, Parsed data and Raw data.
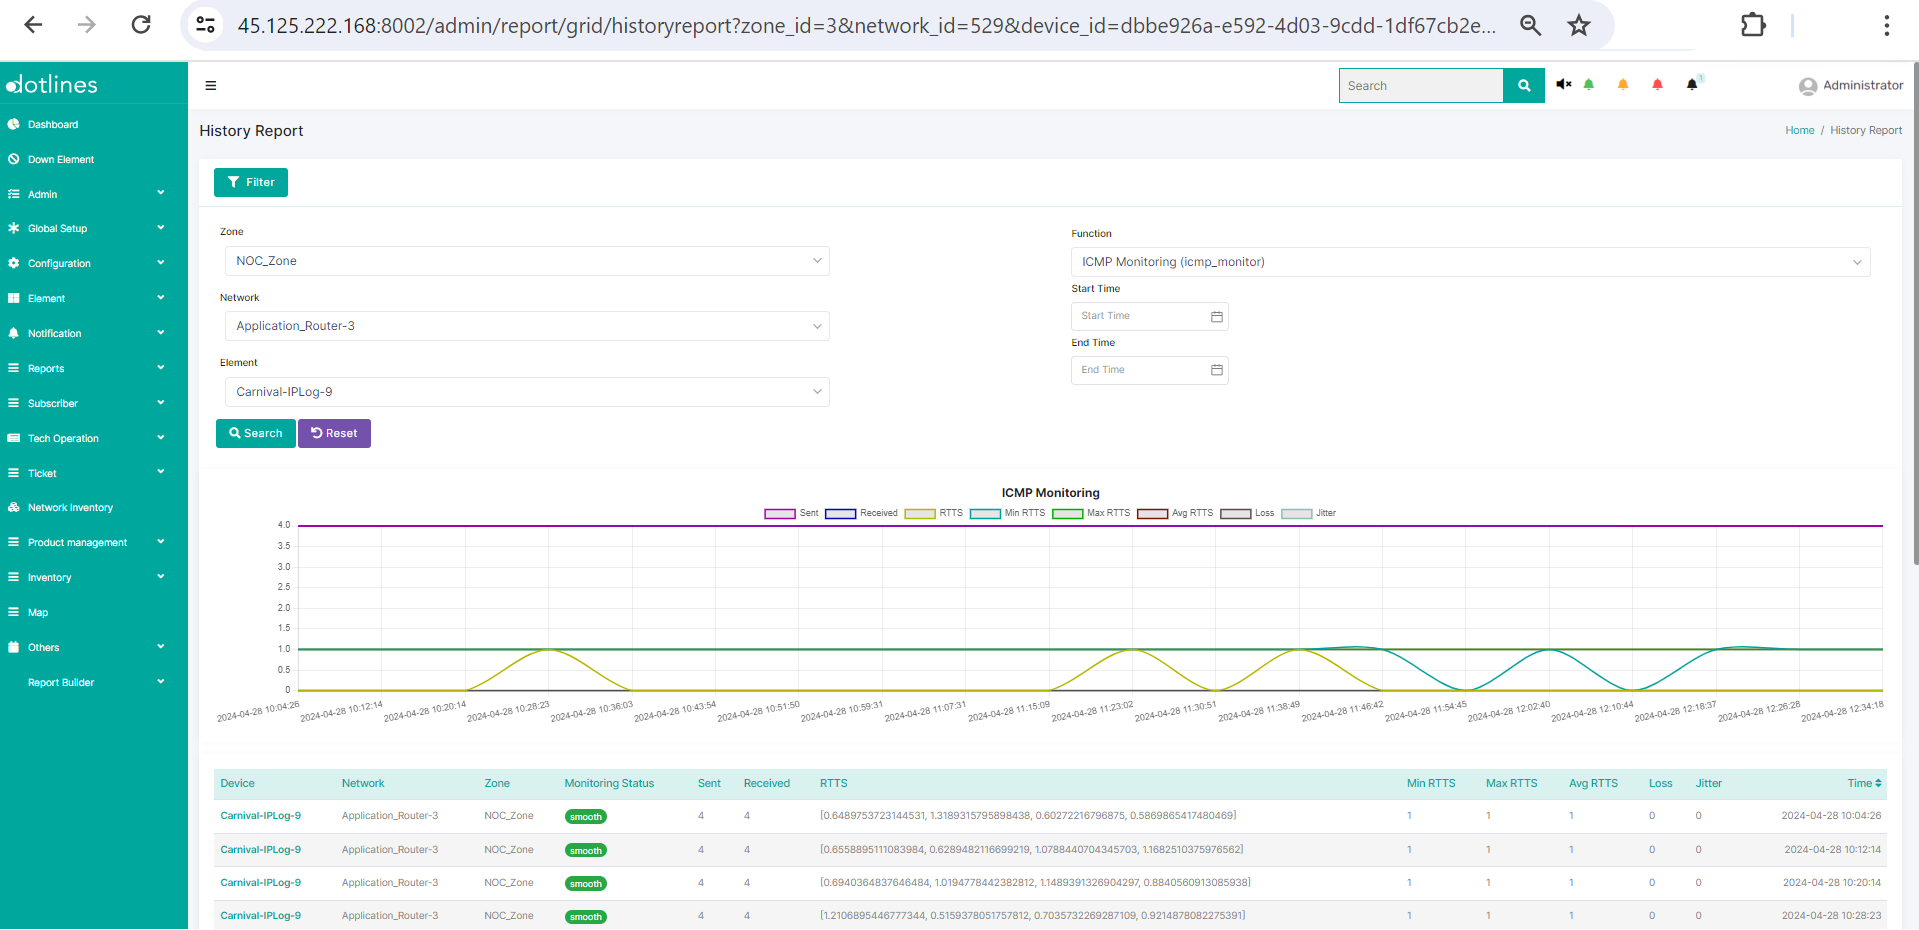
6. From Device Command Page, click to get the monitoring history report containing Device, Network, Zone, Monitoring Status, Sent, Recieved, RTTS, Min RTTS, Avg. RTTS, Loss, Jitter, Time(in date-time format)
Did this article help?